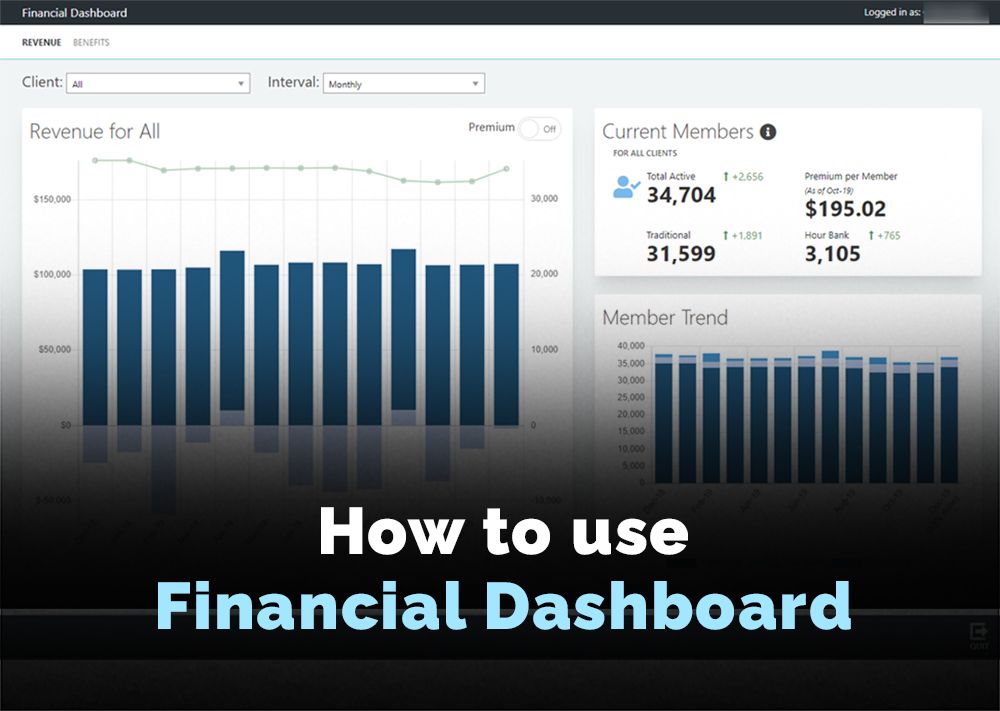
How to utilize Financial Dashboard in iBenefits
CWI built the financial dashboard for the decision-makers to oversee their business and their clients.
There are three tabs within the module - Revenue, Benefits & E-signatures
Revenue
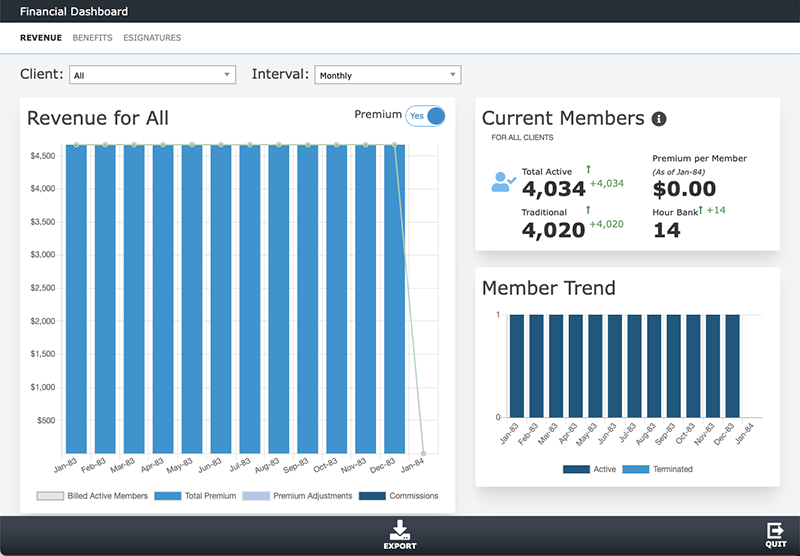
The Current Members section shows the current number of the total active, traditional and hour bank members and the premium per member. The small number displays the increase and decrease in the number of members compared to the last month.
The Member Trend section allows the trend view of the traditional, hour bank, and terminated members.
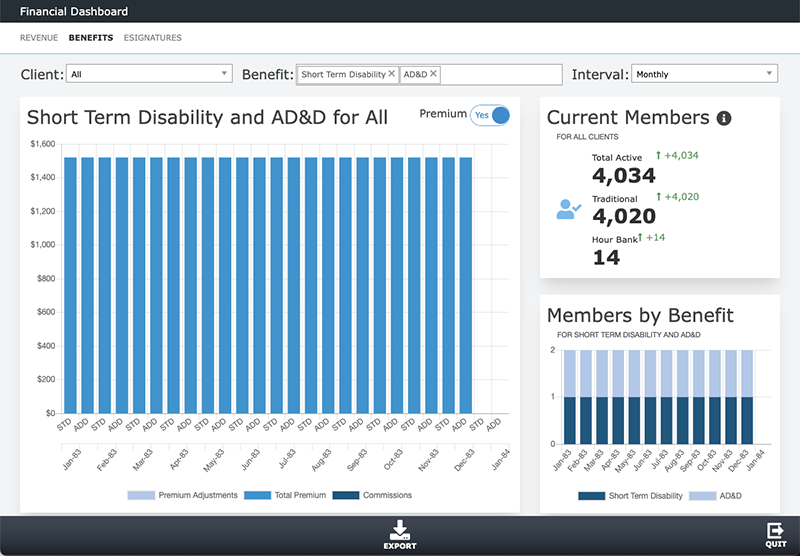
Benefits
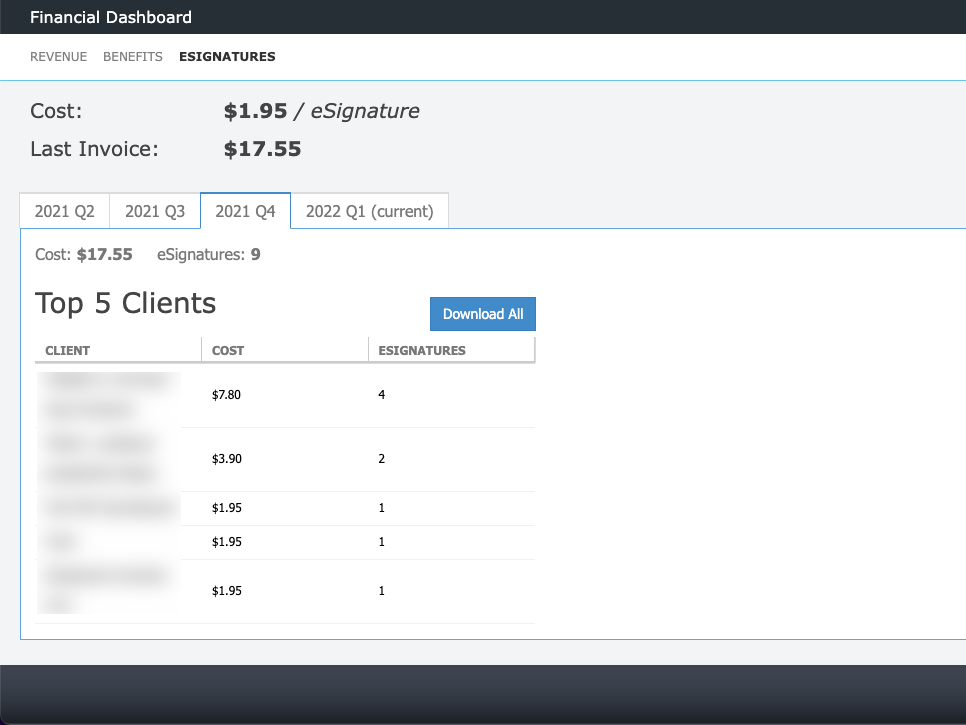
E-Signature
If you have any questions about our team or the group benefits administration software, don't hesitate to contact us.